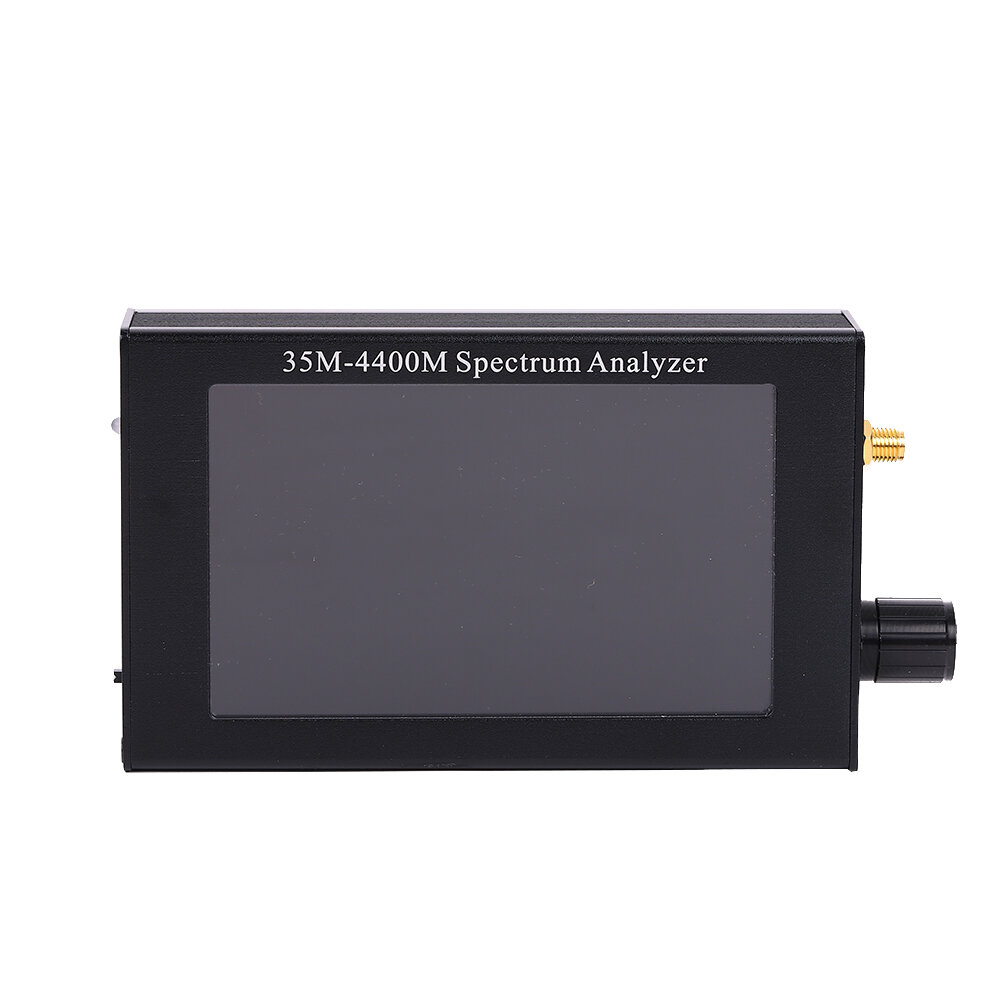
Specification:
Spectrum display range: 35Mhz-4400Mhz
Input impedance: 50 ohm
RBW: 100kHz, 200kHz and 500KHz are adjustable
Number of screen scanning points: 700
Scanning span: 70m (100kHz), 140m (200kHz), 350m (500KHz)
dBm range:-70dB ~ +10dB
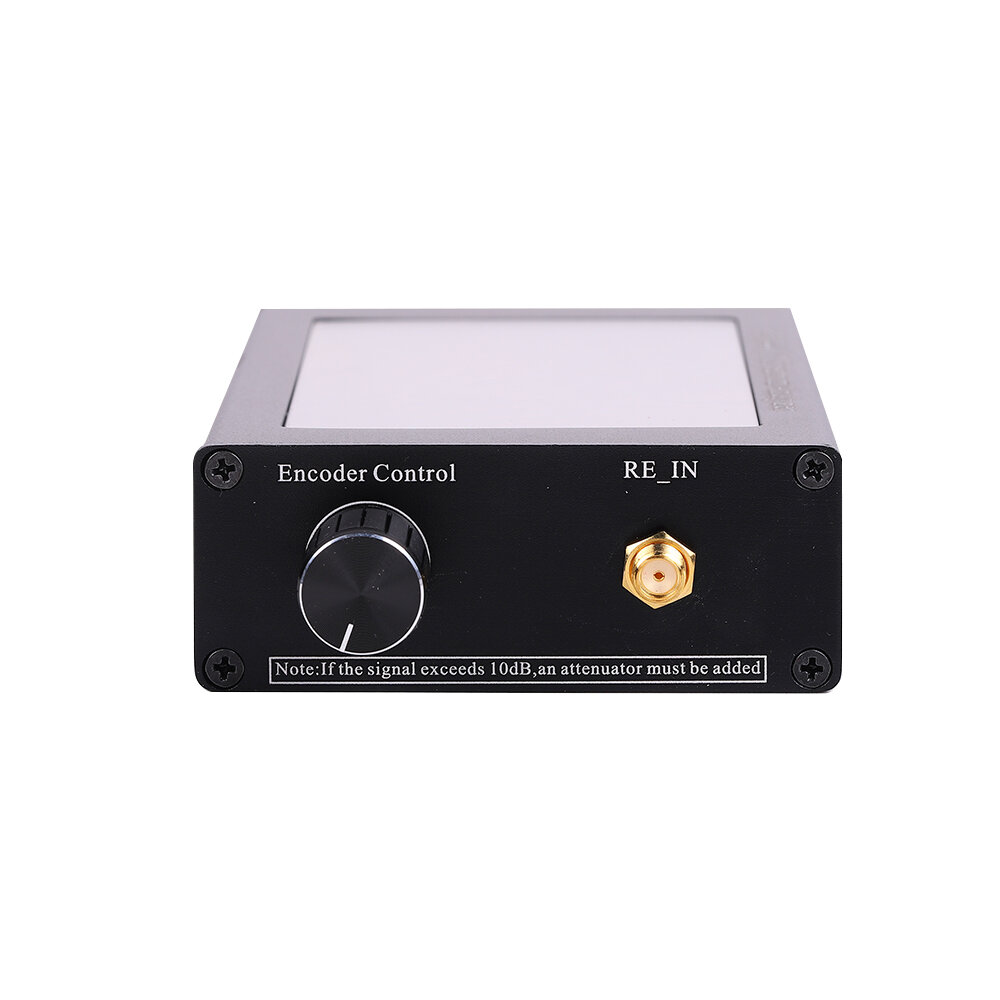
There is no amplification circuit inside the machine. If small signal needs to be measured, external amplifier is required
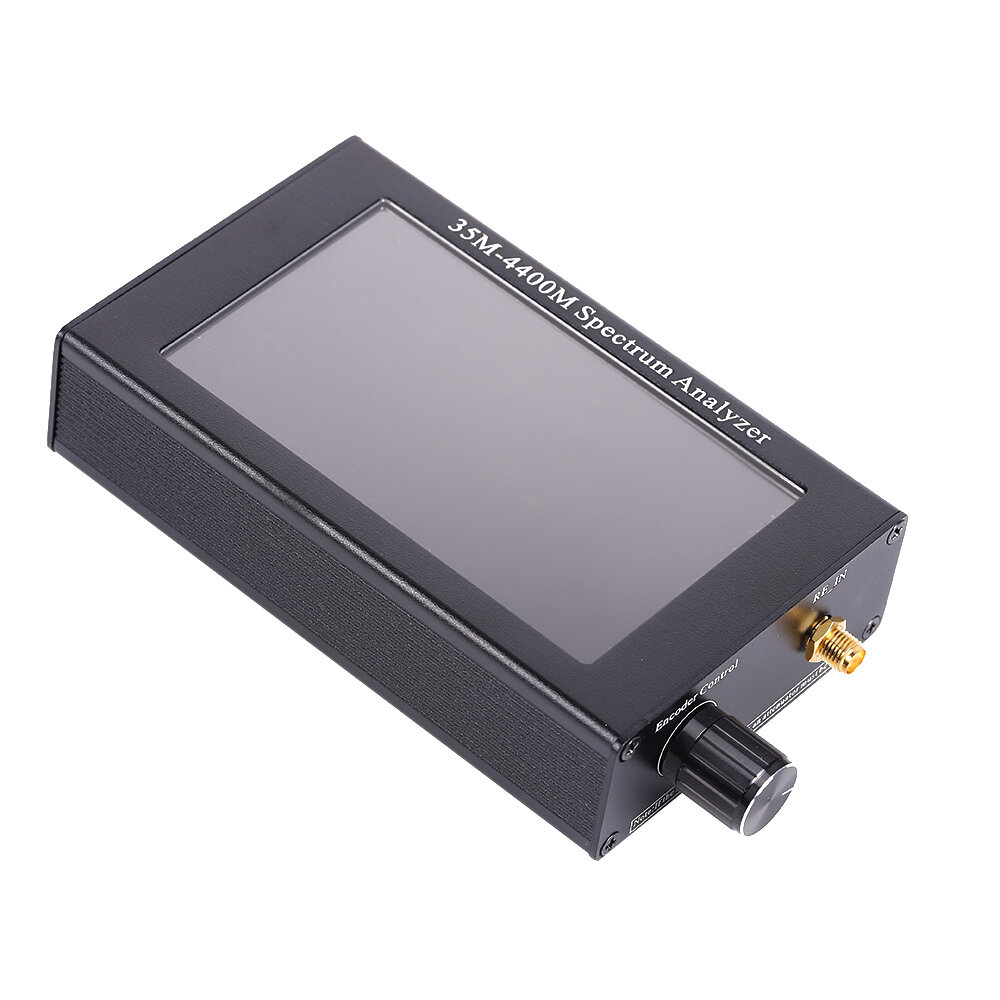
Adopt STM32F407VET6 single chip computer+ 4.3-inch TFT LCD (480 x 800) color LCD screen.
All aluminum alloy shell + rotary encoder control + all English display interface + USB power supply
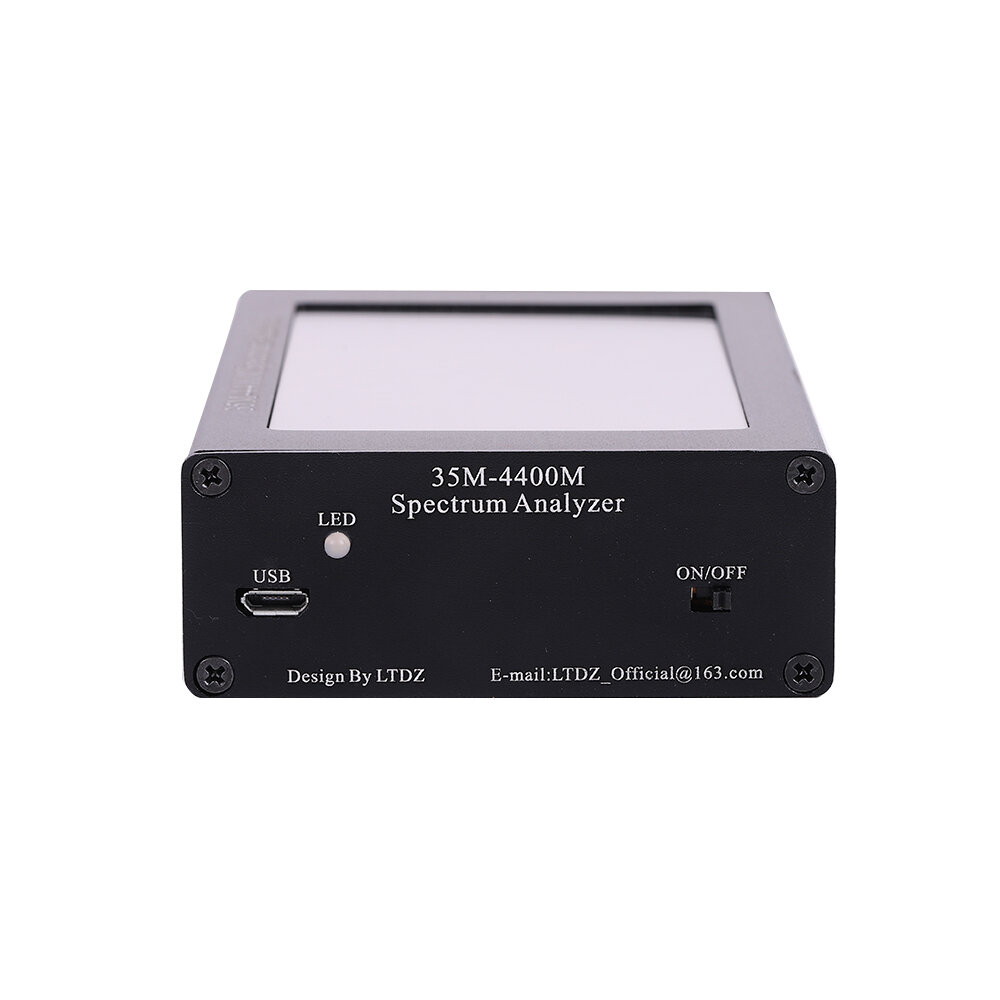
USB power supply
Size: 145mm x 70mm x 30mm
Weight: 250g (excluding battery)
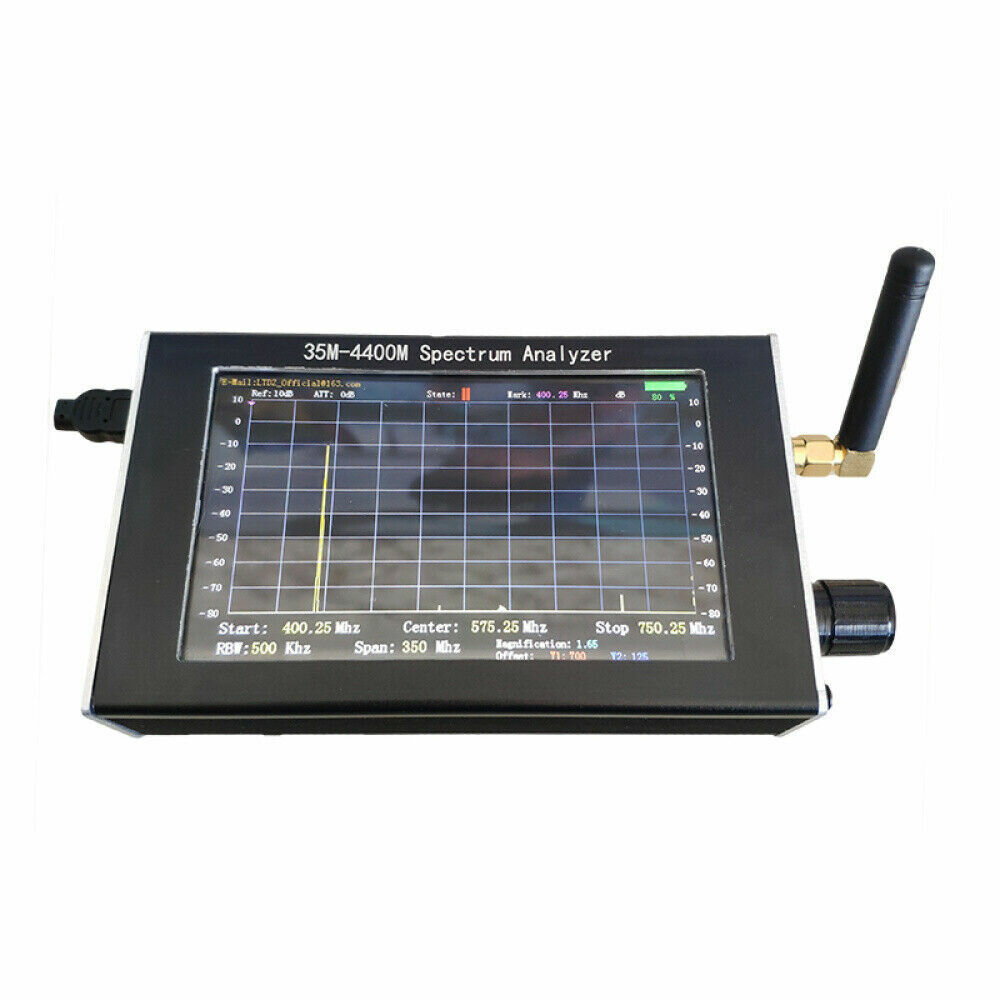
Display interface menu introduction:
(1)<Ref>:Reference level. default + 10dB (This version cannot be changed).
(2)<ATT>:Signal attenuation.(NC,To be developed).
(3)<State>:Working status,.you can control whether the spectrum is scanned by pressing the encoder. Parameters cannot be changed in scan state. Working parameters can be configured in the suspended state. Power on enters the scanning state by default. You can press the encoder to put the device into the pausing state, and then rotate the encoder to select different menus for setting. When you select different menus, the background of menu items will turn white. When the menu item turns white, press the encoder to enter the menu parameter setting function.
(4)<Mark>:Marker bit. In the scanning state, you can rotate the encoder to control the buoy to move on the screen and display the frequency of different positions. If the spectrum of the test signal appears on the screen, you can move
the buoy to display the frequency value of the measured signal.In this version, the marker bits cannot be updated automatically, and must be adjusted manually.
(5)<BAT>:BAT.In the upper right corner of the screen, battery information is displayed. By default, the device does not assemble batteries and uses USB cable for power supply. If you need batteries, you can contact the supplier to provide
the version of the included batteries. The device supports 2000mAh lithium batteries and can work continuously for 4 hours.
(6)<Start>:Starting frequency. In the pausing state, rotate the encoder until the start menu background turns white, and press the encoder to enter the start frequency setting. The center frequency,stop frequency ,span will change automatically according to the start frequency and RBW value without setting.
(7)<Center>:Center frequency.In this version, the center frequency value does not need to be set, only the start frequency and RBW value need to be set, and the center frequency will be calculated and updated automatically.
(8)<Stop>:Stop frequency.In this version, the Stop frequency value does not need to be set, only the start frequency and RBW value need to be set, and the center frequency will be calculated and updated automatically.
(9)<RBW>:Minimum resolution?The device uses 480 * 800 color TFT screen and 700 points in the middle as scanning width. RBW can set 100kHz, 200kHz and 500KHz, so the scanning width that the screen can display at one time is 70m-350m. Important note: when the device hardware filter is 500k,and RBW is set to 100K – 500k, the effect is the best. Because the equipment adopts the heterodyne scanning mode, the local oscillator signal and the signal to be tested
will generate the differential frequency signal through the mixer, and because of the fundamental harmonic, there will be multiple groups of combined differential frequency. In order to select the most appropriate differential frequency signal, the filter bandwidth is 0-500k, That is to say, when the difference between the local oscillator signal and the frequency value of the signal to be measured is between 0-500k, the difference frequency signal will enter the geophone through
the filter. So if you know the approximate frequency range of the signal to be tested, for example, to test the signal of the walkie talkie, the default frequency of the walkie talkie is about 462m, you can set the RBW to 100k, so the span is 70m, the start frequency can be set to 430m, and the stop frequency is 500m. On the contrary, if you don’t know the approximate frequency of the signal to be tested, you can set the RBW to 500K to expand the single scanning range and search the signal quickly. When the signal is found, you can reduce the RBW to check a more accurate spectrum.)
(10)<Span>:Scan width.In this version, the Scan width value does not need to be set, only the start frequency and RBW value need to be set, and the center frequency will be calculated and updated automatically.
(11)<magnification>:Multiple parameter.This is a very important parameter. It is used for calibration. Before leaving the factory, it will make a simple calibration for the settings. If it is found that the waveform error of the spectrum is very
large in use, it can be calibrated by modifying this parameter.
(12)<offset>:Y1: Modify this parameter to raise or lower the overall position of the spectrum waveform. The default bottom noise waveform is about – 75db. If you adjust the parameter of recognition, generally you need to adjust Y1 to move up or down the whole spectrum waveform. If the low noise is at the bottom of the screen, forming a straight line, the value of Y1 should be increased appropriately, and the low noise should be adjusted to about – 75db. Y2: Spectrum power value fine-tuning, when modifying this parameter, it is important to modify the offset of the original ADC data, which will affect the display waveform position, but it is not as obvious as the mapping and Y1. It is mainly used for fine-tuning, and generally does not need to be adjusted.
Package included:
1 x Spectrum analyzer
1 x USB cable
Details Pictures:


 Availability:
  Shipping: Free Airmail


Reviews
There are no reviews yet.